


The Payback Period Heuristic
Heuristics, like rules, are meant to be broken

"This is the essence of intuitive heuristics: when faced with a difficult question, we often answer an easier one instead, usually without noticing the substitution." - Daniel Kahneman
The Payback Period Heuristic
Everyday, we live our life by following heuristics. A heuristic is a mental shortcut that allows people to solve problems and make judgments quickly and efficiently. These “rules of thumb” are actually very helpful in making faster decisions by narrowing in on the most important information and variables. As a Venture Capitalist, I have been thinking a lot about a particular heuristic VCs use when evaluating software businesses, The Payback Period Heuristic:
“all great SaaS businesses should have less than 12 month Payback Periods” - The Payback Period Heuristic, Arthur Rock (joking)
In many conversations with other venture investors, and founders, it has been interesting to discuss some of the flaws with the Payback Period heuristic, as well as exceptions to the rule. My goal is to share some of my early thoughts around these flaws and exceptions for my fellow investors. Many times we in the private markets may deem a business to be one not worth investing in due to our inability to break away from the Payback Period heuristic when it is warranted to do so. I hope after reading this people may more often consider if a company is worth breaking the heuristic for. I am not attempting to question this heuristic, as it is a true one, and investors and founders should continue to adhere to it - however, it may not necessarily be dogma.
Payback Periods 101
For a refresher, Payback Periods are simply how fast you recoup your customer acquisition costs from gross margin generated by the acquired customer. If your payback period is fast, then you have a growth model which is hyper efficient and sustainable as you can turn dollars to acquire one cohort into more dollars to acquire your next cohort, instead of solely relying on balance sheet dollars to do so.
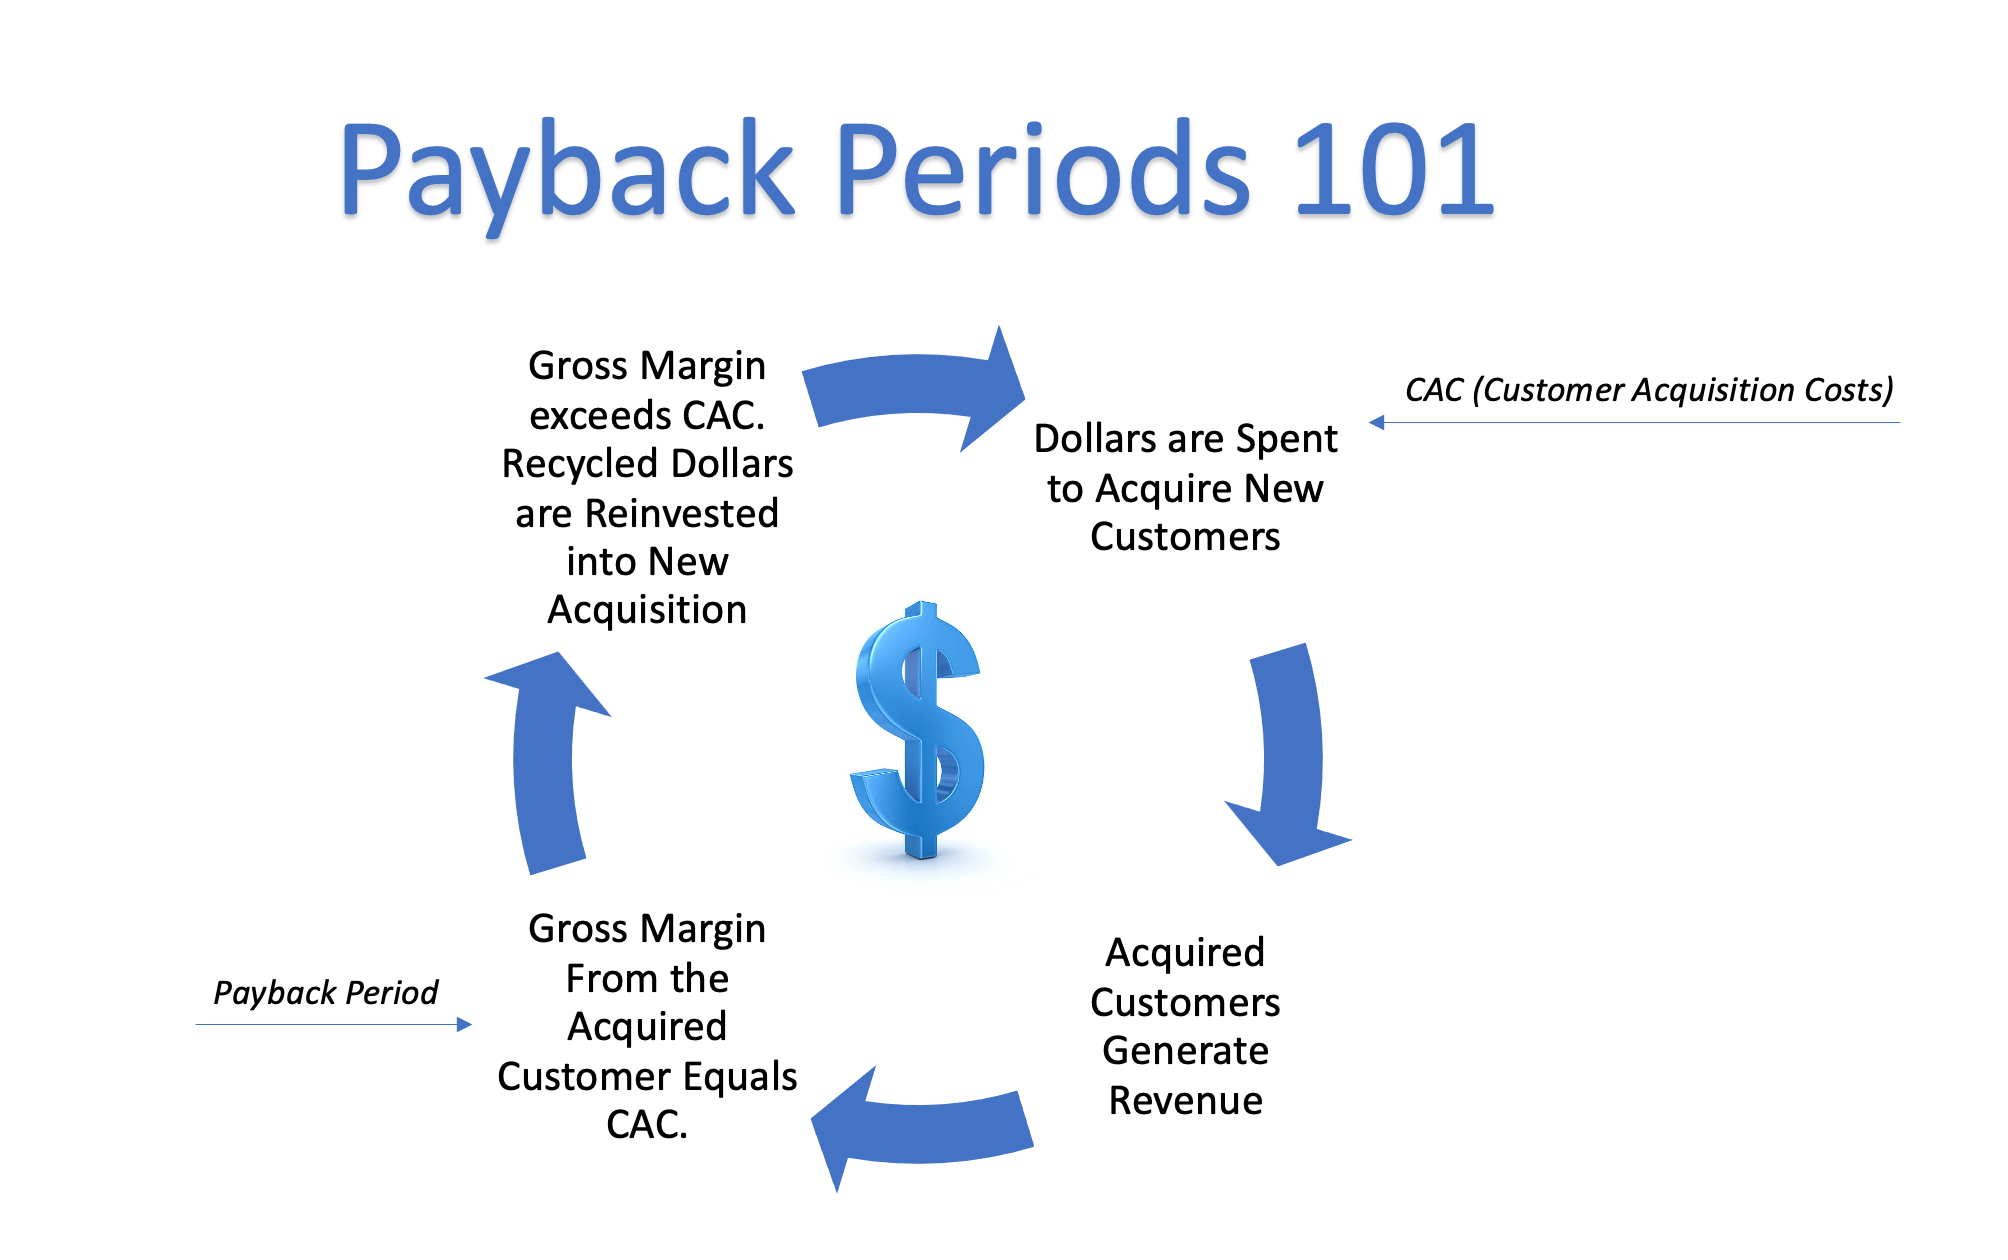
A company is also able to do more with the business in theory, as freed up working capital can be used for other uses beyond acquiring the next customer. Tomasz Tunguz and David Skok have great, and simple, summaries (here and here) on why shorter payback periods are indeed fantastic that I recommend checking out. The majority of companies should seek this kind of efficiency as there are a graveyard of companies who did not adhere to display strong payback periods and good venture dollars went after bad by investing more into unsustainable growth.
Don’t Be A Zealot
Heuristics are worth following, but blind adherence to anything is never good. Blind adherence can just simply lead to mistakes in missed opportunities, or to zealots who religiously stick to a flawed ideology without even fully understanding it. It is always important you understand any flaws in a heuristic, as well as context for when following it is good, and when NOT following it is good.
I am going to spend my time explaining how The Payback Period Heuristic is not always applicable for every business, but it is worth mentioning how it is flawed in 2 specific ways as well:
Faultiness of CAC: The first thing worth mentioning is that if a company simply calculates CAC1 as S&M2/gross new customers over a period of time, then they may not be properly measuring out wasteful marketing spend that is hard to track and should not necessarily be considered. As a blended number, CAC also does not properly account for the different costs associated with each channel (e.g inside sales reps vs. paid advertising). This is more commonly seen in B2B businesses.
Impact of low ACVs: The other thing to think about is how ACV3 is a reflection of the annual revenue associated with acquired customers and many times it is far too low for growing startups. For example, let’s look at a hypothetical business spending $10,000 to acquire a customer with an ACV of $7,000 exhibiting a 24 month payback period assuming 72% gross margins. Then, based on customer feedback, ACV is doubled. Magically, this business goes from a 24 to 12 month payback period with 0 change in qualifying leads or their acquisition costs/strategy. So was the business inefficient, or was the product just priced wrong?
These are not major issues, and once again I think adherence to the heuristic is correct, but it shows how it is not an entirely accurate measurement. There are times where adherence to the heuristic guides VCs to help founders think about growth in a sustainable way, as they should. But it can also force VCs to make certain businesses strictly follow this heuristic against their own benefit by adopting a different GTM and implementation strategy, spending less on sales to acquire new customers, or not investing too much into their customers, when they should be.
So how do you determine whether a business can follow, or not follow, The Payback Period Heuristic? For context, as a VC I strongly adhere to The Payback Period Heuristic, but after running into a few businesses I really liked that had longer than 12 month payback periods, I began to think more about this rule of thumb over the past year. These businesses were performing really well, and most importantly, the more time I spent on them I began to deeply understand and feel comfortable with why payback periods were longer. Many of the best founders track payback periods as a metric, but internally they have a much more holistic view on operational efficiency and the ROI from customers than their investors do. So if founders don’t ALWAYS worship the heuristic, should VCs?

Customer Investments
Let’s take a step back and adjust our mental models here. When an investor thinks about an investment, he or she thinks about different metrics to measure the success of that investment (e.g MOIC. NPV. IRR. LTV, etc)4. One of the things to think about when determining which is the appropriate metric, is what kind of capital is being deployed and what is being invested in. If a venture investor is thinking of a business’s customer relationship as an investment then he or she should be thinking in the appropriate proxies.
Payback Period is a proxy, but, depending on a business model one may need to measure investments differently. Many use CAC/LTV as a corresponding proxy to Payback Periods. Without diving into the faults of LTV (for more on this I recommend reading Bill Gurley’s work here), generally, this is a good proxy and framework to have especially if playing the cash flow reinvestment game that drives adherence to targeting <12mos Payback Periods. However, there is another framework. If a company says we are not going to use cash flow from customer 1 to buy customer 2, instead, we will finance or invest from our balance sheet (investor dollars) against the long term performance of customer 1, in this case, it’s more of an NPV framework. This is a longer term mindset and requires thinking more about the back loaded ROI associated with the customer, which ultimately ends up developing a longer term mindset regarding each customer acquired and the costs associated with acquiring them.
Eight Dynamics
When researching this topic more, it surprised me to see how there are many successful publicly traded software business with long Payback Periods - Salesforce, Snowflake, Palantir, Okta, Hubspot, RingCentral, GitLab, DocuSign, ServiceNow, and many more seem to exhibit roughly anywhere from 15-35 month Payback Periods. Jamin Ball made a great chart showcasing gross margin adjusted CAC Payback for top quartile SaaS businesses (see below).

How is this so? Is it purely due to the different decision trees of the public markets vs the private markets? Maybe. Without diving into each business respectively, at the end of the day businesses with longer Payback Periods can still grow rapidly, sustainably, and with high margins - it just depends on the product, the industry, the customer base, and the business model. They do this by exhibiting what I call The Eight Dynamics which are dynamics healthy and successful businesses with longer payback periods seem to exhibit. Startups may not have these dynamics in the early days, but if they have some now, and the potential for all 8 later, it may be worth considering them as an exception to the Payback Period heuristic. See below for a breakdown of these dynamics.
The Eight Dynamics:
Longer Customer Lifetime - You need customer’s lifetimes to be long so you can see increasingly profitable unit economics, and revenue expansion, on the backend of the customer’s lifecycle. This is why we usually see successful SaaS businesses with longer payback periods.
Larger Customers and Larger ACVs - A high growth technology company needs to, well, grow. Overtime, growth comes from your existing customer base expanding and from acquiring new cohorts of customers. Longer payback period businesses that have scaled overtime, should, overtime, see a larger percentage of growth attributable to net expansion vs net new dollars solely. Many of these longer payback businesses have a large, and growing, customer base of large enterprises, and they tend to also have large, and growing, ACVs.
Switching Costs - Switching costs can be defined as the costs that a consumer incurs as a result of changing products. These businesses become ingrained in their customer’s stack and/or workflow, develop downstream revenue dependencies, and become very difficult to rip out. This is a critical component, as it gives them the time to see profitable economics on their customers.
Large and Expanding Market with a Nascent Industry or Technology - This is where you are on the market adoption, or S curve, of a product or market. If an offering is a 0—>1 type company, but early in its lifecycle (e.g Palantir, UiPath, DataRobot, Procure or other vertical SaaS where you're selling to non technical companies etc.) there's a lot more effort required to educate the relevant buyer (CTO / CISO / etc.) in the early phases of the market adoption. In software, the name of the game is to build a product and figure out how to distribute it broadly. Aggressively building out your salesforce in the early years to sell newer technology to less educated buyers can be costly, and can lead to longer paybacks, but it can also be a massive long-term distribution advantage as your customers and the market matures.
Large and Expanding NDR5 - Solely having switching costs is not enough without strong NDR. Long term customers need to expand their spend with you as they expand their own headcount, subsequently expanding seats and usage. They also need to expand their product usage as you add to your own product suite and cross sell to new organizations and upsell within existing organizations in the company. Companies with longer payback periods tend to end up being ones with best in class NDR.
Top Down Sales Motion - These businesses tend to have a top down sales led motion which equates to a longer sales cycle, taking more resources from sales engineers and the C Suite to educate, sell, and train the buyer. But the investment is well worth it, due to the larger ACVs, and management buy-in, associated with a top down sales motion.
Innovation Initiative - Sometimes outside pressures, or internal initiatives, force a company to prioritize innovation and heavily invest within a new market and product type to achieve an outward, often buzz-word-y, goal. I call this an Innovation Initiative. The Innovation Initiative impacts many of the other dynamics as it expands TAM, supports the top down sales motion, increases ACV, supports NDR growth, and more. Enterprise AI is a market where you see an Innovation Initiative that has Fortune 500 management teams bought in at the top to invest in adopting and using AI to make their businesses more profitable and efficient. There is almost an arms race dynamic here with outside pressure from the markets to show “digital transformation” and that in turn has forced larger enterprises to divert resources to adopting AI faster and better than their competitors. This has benefited companies like Palantir, Snowflake, DataRobot, Databricks, C3.ai, and more because they have customers that are committed to, and invested towards, the same goals; even if they take time to get over the learning curve and technological transformation timeline. In some ways, HRIS tools are experiencing an Innovation Initiative among enterprises, but that’s another conversation.
Balance Sheet - Certain businesses with strong balance sheets, whether large amounts of dollars raised or immense profitability, can break this rule by pushing out payback periods and seeing their existing customer base expansion drive top line growth. The biggest thing that allows a company like a Salesforce to push out paybacks (24 mos) is the fact that it’s still running heavily cash flow positive in spite of those payback periods. When a startup is scaling, the capital efficiency of short paybacks is much more important because they’re burning money and risk heavy dilution if they burn too much, but for a profitable company it’s of much less importance. For an unprofitable (public or private) business to do this, they need to raise large amounts of dollars over their “customer investment period”. I will dive more into this later in our case studies.
To further illustrate this point let us look into two successful businesses with The Eight Dynamics that withstood longer payback periods to get to larger ROI’s from its customers.
Case Study #1: Palantir

It was actually while diving into Palantir that I first began to think about successful businesses with longer payback periods. Palantir is a data integration, visualization, and analytics platform that sells two software platforms - Gotham to the US Government and its allies, and Foundry to the largest commercial enterprises in the world (there is, of course, crossover among customers between products). Not only is Palantir a massive company, currently a $30B market cap business supporting the largest institutions in the world, but Palantir is also a fantastic example of a successful software company with long customer payback periods. Palantir invested for over a decade in their product and technology, into a new market, and most importantly their customer base, and they began to see results due to the long term, sticky nature of the product afforded by the large switching costs. With that lower churn, and a product where customers grow and spend more with you over time, they were able to build a great business despite having longer payback periods on those initial customers. The Eight Dynamics are allowing Palantir to have sustainable growth with a long-term investment mindset when it comes to their customers.
The best way to understand their long-term investment strategy is to look at their three phase business model.
Palantir’s business model has three phases: (1) Acquire, (2) Expand, and (3) Scale.
Acquire phase customers are those that, at the end of a calendar year, have contributed less than $100,000 in revenue in that respective year. Palantir actively pursues discussions with existing and prospective customers in order to identify ways in which their software platforms can provide long-term value. This first phase consists of new opportunities with minimal risk to the customers through short-term pilot deployments of Palantir’s software platforms at no, or low, cost. During these short-term pilots, they operate the accounts at a loss believing that their investments during this phase will drive future revenue growth.
Expand phase customers are those who have contributed more than $100,000. Palantir typically expects these accounts to have negative contribution margins. Palantir’s investment in this second phase is often significant as they seek to understand the principal challenges faced by customers and ensure that their software delivers value and results.
Scale phase customers have contributed more than $100,000 with best in class positive contribution margins. As customer accounts mature, Palantir’s investment costs relative to revenue generally decrease, while the value their software provides to the customer increases, often significantly, as usage of the platform increases across the customer’s operations. In this third phase, after having installed and configured the software across an entire enterprise, customers become more self-sufficient in their use of their platforms, including developing software and applications that run on top of the platforms, while still continuing to benefit from the support of Palantir’s operations and maintenance (“O&M”) services.

In 2019, of Palantir’s $742.6m in total revenue, $0.6m came from customers in the Acquire phase, $176.3m came from customers in the Expand phase, and $565.7m came from customers in the Scale phase. In 2020, those same customers generated a total of $1.1B in total revenue (47% YoY), where Acquire phase customers generated $77.1 million in revenue which yielded contribution profit of $13.2 million, Expand phase customers generated $360.4 million in revenue with a contribution margin of 47%, and Scale phase customers generated $613.4 million in revenue with a contribution margin of 70% (up from 55% in 2019) with 95% of revenue coming from these existing customers. Growth is coming from the existing customer base, and the investments are paying off as Scale phase customers acquired many years ago are now yielding a huge ROI and driving the majority of revenue and margin.
Palantir’s growth is driven more from the long-term investment into massive long held customers, rather than efficient and fast acquisition of, and re-investment toward, new customers.
Let’s summarize where we see The Eight Dynamics with Palantir:
Longer Customer Lifetime - Palantir only has 149 customers (a fraction of what a typical SaaS business has) and their top 20 customers (who contribute ~60% of total sales) have an average lifespan of ~7 years. Some of their public sector customers have been around for over a decade.
Larger Customers and Larger ACVs - Palantir is a bit of an extreme example given their very abnormally large ACVs, but the dynamic is there nonetheless. In 2020, of Palantir’s 139 customers, ACV was $7.9 million, and the ACV for their top twenty customers, by revenue generated in 2020, was $33.2 million. This is up from 2019, where ACV was $5.6 million, and the ACV from the top 20 customers, by revenue generated in 2019, was $24.8 million.
Switching Costs - Palantir’s products have large switching costs associated with them as they become the system of record and operating system for critical workflows leveraging data ingestion, visualization, automation, analytics, and more. Large enterprises use Palantir software for mission critical use cases that develop downstream revenue dependencies, giving a large financial cost to ripping Palantir out. The financial cost of switching is also too high for private sector customers, as the government leverages Palantir to modernize their capabilities and have invested billions of dollars into the development of these capabilities, many of which are custom solutions.
Large and Expanding Market with a Nascent Industry or Technology - Palantir estimates its TAM6 as $119B and it is benefitting from the massive growth in spend from the private sector on data analytics, automation, and AI, as well as the public sector on modernizing its tech stack and increasing investment into C4ISR7 capabilities. Palantir’s market is full of customers who are all modernizing and developing new data capabilities, which required the use of forward deployed engineers to build and implement custom solutions for them. This was costly, but built sustainable competitive advantages through distribution, GTM proficiency, information asymmetries, and switching costs.
Large and Expanding NDR - Although Palantir does not disclose this metric, we see the long term trend of customers starting from acquire and ending in the scale phase which contributes to the majority of revenue, as well as the growth in ACVs among each phase of customer.
Top Down Sales Motion - Whether the commercial, or public sector, Palantir runs a top down sales motion with the necessary use of Forward Deployed Engineers to ensure customer success. Employing a much longer, and more expensive sales cycle.
Innovation Initiative - The government, and large enterprises, are bought in at the top on accomplishing digital transformation and need to invest in new software tools to ingest, understand, visualize, productize, and analyze data to run their core operations.
Balance Sheet - Palantir raised $3B over the course of its life as a private company and invested these dollars back into the product, the market, and its customers. Palantir suffered from lower margins during this time, and many even considered it a services business. However, that investment paid off and the back loaded ROI from that investment is clear as I detailed above. This dynamic is only possible due to a large balance sheet. Palantir is an extreme example given the market and customers they were going after, but this same dynamic applies, albeit at a smaller scale, for other industries.
Case Study #2 Snowflake:

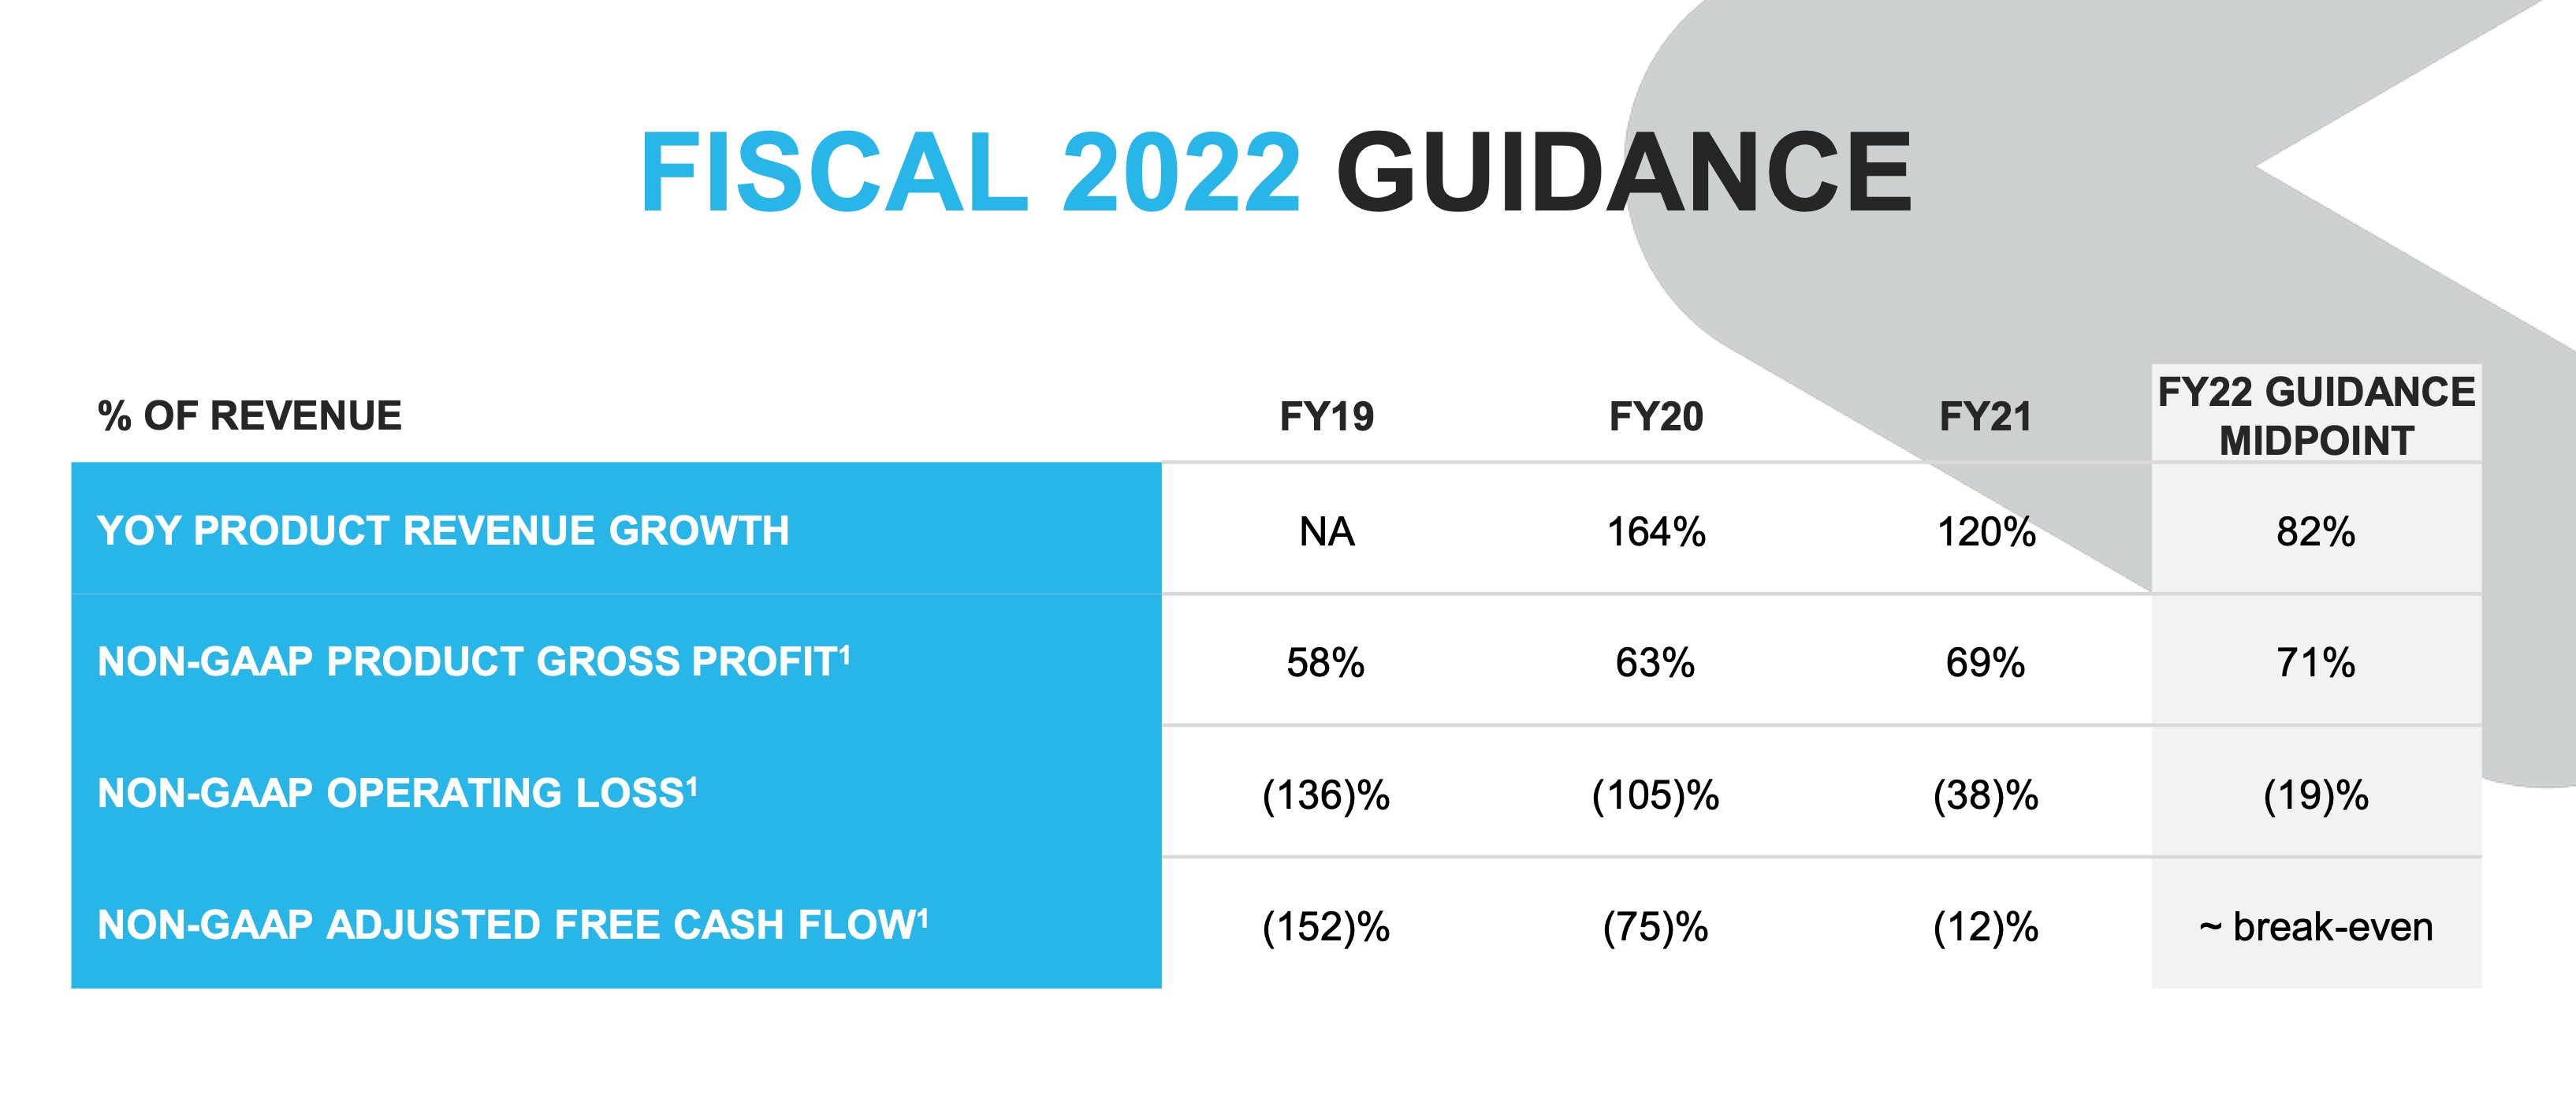
Snowflake is a cloud based data warehousing company allowing enterprises the ability to leverage one platform to run all of their data workloads on top of. Snowflake is the cornerstone of the modern data stack and has been one of the players revolutionizing how enterprises manage and use their data, allowing them to build databases irrespective of data type, scale, or need on top of any cloud (Azure, Google Cloud, or AWS). They pioneered the category, separating storage from compute, and have seen incredible growth over the years since their founding. Snowflake went public in 2020 with the largest software IPO ever, and is currently valued with an $86B market cap. Snowflake’s scale is incredible, doing $592M in revenue this year (124% YoY), and projecting over $1B FY22 revenue (~109% YoY) after being founded just 9 years ago. Snowflake has long 23 month payback periods, largely due to the longer time-to-value associated with their product. Although trending downward, it still takes customers 200+ days to migrate over to Snowflake. Switching costs are built due to the commitment by the customer to get off an on-prem infrastructure and migrate data to Snowflake’s cloud platform, at the sacrifice of payback periods. Although still unprofitable, Snowflake has seen steady improvement in their fundamentals (improving free cash flow and operating income metrics) all the while breaking the Payback Period heuristic.
As we see, Snowflake is a stellar example of a business with The Eight Dynamics and a great brief case study as a comp for many of the growth/late stage companies with longer payback periods that are still private. Let’s summarize where we see The Eight Dynamics with Snowflake:
Longer Customer Lifetime - Snowflake has a 5 year customer lifetime, and given the growing focus on larger enterprises, this lifetime will continue to grow as well.
Larger Customers and Larger ACVs - Snowflake’s ACV is $165k, still very large for SaaS businesses, but data shows this number will continue to trend even higher. Snowflake saw 46% YoY growth in 4Q21 among its Fortune 500 customer base, and 88% YoY growth among its customers doing over $1m/yr in product revenue - this is growing even faster than their customer count. Snowflake is targeting a 2029 goal to have 77% of their product revenue ($10B target) come from $1m/yr customers. These $1m/yr customers are doing $3.4m/yr on average, and in 2029 they hope to see that number increase to $5.5m.
Switching Costs - Snowflake’s platform has large switching costs as the data warehouse is a data management system that becomes the system of record/source of truth for an organization’s data, enabling everything from BI8 to data science. Thus, Snowflake becomes ingrained within all of an enterprise’s critical workflows and applications developing downstream revenue dependencies, giving a large financial and technical cost to ripping Snowflake out.
Large and Expanding Market with a Nascent Industry or Technology - In 2021, Snowflake estimated their Data Cloud market at $90B (growing 11% YoY). However, the majority of corporate data and compute is STILL not in the cloud (Goldman Sachs estimates this number is ~30%) and Snowflake is estimated to only have ~17% of the data warehousing market. In short, a lot still happens on-prem, which means there is a learning and technological adoption curve present still among many enterprises to adopt a cloud base data warehouse product and build out the components of a modern data stack. However, Snowflake is the pioneer of the cloud data warehouse, and the migration of data, compute, and warehouses to the cloud is not a matter of if but when for enterprises. With this massive advantage as the market matures in their favor, Snowflake has warranted the prolonged “customer investment period”.
Large and Expanding NDR - Snowflake has one of the best NDR rates in the world with a 168% NDR rate in 4Q21. Much of this is attributable to their consumption based pricing model centered around usage. In short, Snowflake customers’ usage is increasing more and more over time, and thus they are spending more and more over time.
Top Down Sales Motion - Snowflake has a classic top down enterprise sales model (AEs, inside sales, partnerships). While they offer 30-days trials, they don’t use much of the bottom up, free tier, and open source GTM9 tactics.
Innovation Initiative - Every enterprise right now is focused on modernizing their data stack, and the switch from an on-prem data warehouse to the cloud data warehouse has been a critical component of it (as well as the development of next-gen data lakes, ELT10, Enterprise AI, etc.). There is an arms race of sorts right now in this category and Snowflake is benefitting from becoming part of the de-facto “standard” of what a modern data stack looks like.
Balance Sheet - Snowflake has over $3.9B of cash on the balance sheet, and raised ~$1.4B over the course of its life as a private company and invested those dollars back into the product, the market, and its customers. During this period of high burn as a private company, Snowflake’s margins were improving, but not best in class for a software business. However, that investment paid off, and the back loaded ROI from that investment is becoming clear as detailed above.
In Conclusion
It should be stated again, The Payback Period Heuristic is a GREAT rule of thumb. When a startup is scaling, the capital efficiency of shorter paybacks is much more important because they’re burning money and risk heavy dilution, or going out of business, if they burn too much. It’s important to also not assume today’s cost of capital will always be the same and a company can’t unprofitably burn cash for growth year after year and expect VCs to keep funding it. It is nice to have confidence that if need be, a company can continue to grow without relying on future financings. Great operators know the levers they can pull based on strategic opportunities, or crises, and as venture investors we like to see this lever available as an option to feel comfortable with sustained growth. Period. Businesses are like machines and those with sustainable and efficient growth warrant more dollars, or gasoline, thrown into the engine. However, as we just looked at, certain businesses break this heuristic successfully depending on the opportunity, the market, and the product. This is why The Eight Dynamics are helpful as an investor in evaluating whether or not to be comfortable with a business that breaks The Payback Period Heuristic. If we no longer adhere to this heuristic as dogma, we may feel more comfortable at times investing in companies that break the rule of thumb, and as we saw, sometimes we’d be right in doing so. Saint Jerome said, “the scars of others should teach us caution” and I find this to be ever so true within investing. There are those who did not follow the Payback Period Heuristic and invested in unsustainable businesses that died as they could not raise subsequent rounds due to their inefficient growth, but there also those who did not invest in world class and generational businesses due to strict adherence to the Payback Period Heuristic as absolute truth - missing out on fund multiplying returns. I propose, with humility, that we pay attention to both scars.
Special thanks to Trae Stephens, Alex Jacobson, James Pardee, Everett Randle, Rick Brubaker, Joel Yarmon, and Daegwon Chae for helping me think through this topic to write some of those thoughts down.
All opinions are my own and do not represent 137 Ventures

CAC - Customer Acquisition Costs
S&M - Sales & Marketing
ACV - Average Contract Value
MOIC, NPV. IRR. LTV - Multiple On Invested Capital, Net Present Value, Internal Rate of Return, Lifetime Value
NDR - Net Dollar Retention
TAM - Total Addressable Market
C4ISR - Command, Control, Communications, Computers, Intelligence, Surveillance, and Reconnaissance
BI - Business Intelligence
GTM - Go-To-Market
ELT - Extract-Load-Transform